


How to Improve Website Loading Speed: Tips and Best Practices

For a user, the primary indicator of a good website is its loading speed! Research has shown that users are most satisfied when a website loads in 3 seconds or less, and if the loading time exceeds 10 seconds, 98% of users choose to close the website directly. Such severe user loss is a significant problem for website owners and businesses: no matter how well-designed the layout, how beautiful the visuals are, and how unbeatable the content is, they become useless in this context!! So, what should we do in such a situation?
Before analyzing and solving the problem, it is essential to understand the entire website system clearly. Is the website deployed on a single server or multiple servers? Is load balancing implemented? What is the website's current QPS (Queries Per Second), and how is the load distributed among the servers? It would be best to visualize the architecture for a clear understanding.
In addition, we also need to understand the underlying principles of browser requests. When a user enters a website address in the browser, it goes through a series of complex processes before the page is finally rendered. These processes include DNS resolution, TCP connection establishment, TLS handshake, browser parsing, and rendering (for a detailed process, refer to: https://github.com/alex/what-happens-when). Any issue in each of these steps can potentially lead to a decrease in the website's loading speed. So, how can we quickly identify the problem areas?
Problem Analysis and Identification
Firstly, to identify the reasons for slow website loading, there are usually several methods:
Collecting client information
We generally need the cooperation of users to provide some basic information:
- Is the issue consistently occurring, or is it slow only on the first visit or every time?
If it is slow only on the first visit, it indicates a lack of local caching. If it is slow every time, it suggests incorrect server caching configuration or the website containing too many dynamic requests.
- Is the issue common to other websites? Does accessing high-traffic websites (such as www.qq.com) also result in slow loading?
If accessing high-traffic websites is also slow, it likely indicates local network or DNS issues. Otherwise, it may be specific to the website in question.
- Is there a difference in network performance? Have you tried switching to different Wi-Fi networks or hotspots to see if there is any improvement?
If there is a difference in the experience when accessing different Wi-Fi networks or hotspots, it may indicate a network link problem. For example, if the server is on a telecom network and the client is on a mobile network, there may be inherent delays in cross-network connectivity.
- Are other users experiencing similar issues?
If only a few clients are experiencing the problem, it is likely due to issues specific to their own devices.
We can maintain communication with the customer and verify our assumptions through questioning, continuously eliminating impossible factors, and determining the direction of the investigation.
Packet capture
In addition to gathering information from users, we can also guide them to use browser packet capture for diagnostics. For example, Chrome has developer tools, and the network panel within it can analyze the timing of resource loading, view the loading time of each resource, and pinpoint the slow-loading resources. For detailed instructions, refer to: https://developer.chrome.com/docs/devtools/network/.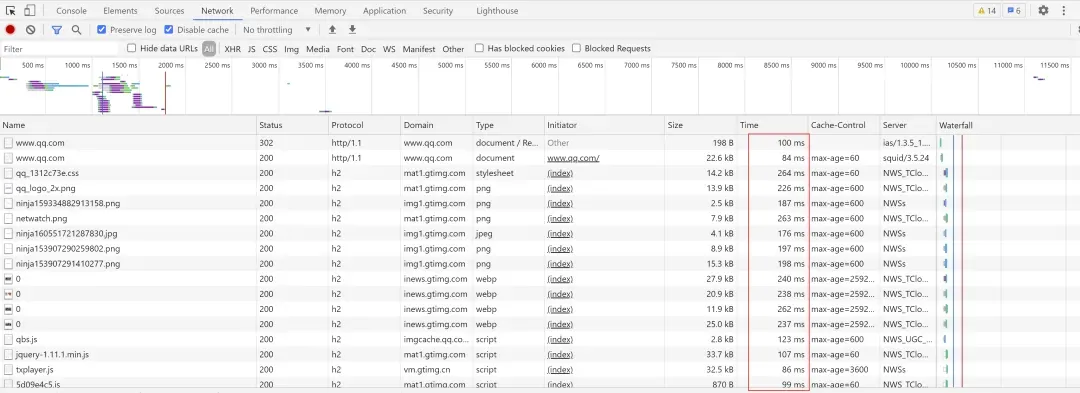
Diagnostic tools
In addition to actively asking customers, we can also use automated diagnostic tools to quickly obtain basic information such as the client's IP, local DNS, and browser version. You can use the following link to access a tool for this purpose: http://debug.ping.dnsv1.com/ping.x.
Third-party probing
Sometimes, to determine whether an issue is isolated or widespread, we can use third-party probing tools for troubleshooting. For example, you can use one-time probing tools like https://www.17ce.com/, or periodic probing systems provided by companies like Borui and Jidiao.
Active monitoring
To quickly and proactively detect client-side anomalies, it is generally necessary to implement tracking and reporting logic in the business code. This involves reporting basic information such as page loading delays to the server for analysis, which is highly valuable for optimizing the page.
It's not only important to implement tracking and reporting logic within the page, but we also need to ensure proper monitoring on the server side. This includes reporting server-related information (CPU/memory/disk/TCP connections/file descriptors) and business metrics (request QPS, latency, thread pool size) to the monitoring system. With comprehensive monitoring in place, we can avoid blind troubleshooting and quickly validate hypotheses, eliminate interference, and pinpoint the root cause by following the monitoring trends.
The above are just a few examples of methods for analyzing and identifying problems. In practice, we often need to use a combination of various approaches to find the issues.
Proposing Problem and Solving Solutions
Once we have identified the root cause, we can propose targeted solutions.
Client-side issues
If the issue concerns the client's network or DNS resolution, they should contact their local network service provider for resolution.
Server-side issues
1. High CPU load on the server
In most cases, this indicates that the server is overwhelmed by the number of requests and its resources are exhausted. To address this, you can consider the following options:
- Load balancing with LB (Load Balancer) services: Introducing a load balancing service, such as Tencent Cloud CLB, can distribute requests from clients to backend servers using specific load balancing algorithms, reducing the load on individual servers. Additionally, it can monitor the health of backend servers and automatically remove unhealthy nodes.
- DNS-based global load balancing: If the request volume exceeds the capacity of a single LB, the LB can become overloaded. In such cases, you can introduce multiple load-balancing services. To ensure that clients can discover multiple LBs, you can modify DNS resolution by adding multiple LB IP addresses as A records.
- EdgeOne Integration: If the website is experiencing a period of growth with an expected increase in traffic, frequent scaling can be a cumbersome and costly process. Purchasing new LBs and servers incurs significant server and network bandwidth costs. In such cases, integrating the website with EdgeOne can be considered. For static resource-based websites, EdgeOne can cache the majority of resources on edge nodes, improving the access efficiency for end-users and offloading nearly 100% of the traffic from the server. The traffic generated by EdgeOne acceleration is more cost-effective compared to regular server-generated traffic, significantly reducing server costs. Tencent EdgeOne provides this capability.
2. Slow First Byte Response
This indicates that the server is functioning properly, but the business-side processing capacity is insufficient. Possible reasons include:
- Poor performance of the web server: For example, Apache servers require creating new threads for each connection, resulting in significant overhead for thread creation, destruction, and switching in high-concurrency scenarios. In such cases, switching to a more performant server software like Nginx is recommended.
- High disk I/O load: Consider using server memory for caching, as memory read/write operations are significantly faster than disk operations, leading to improved performance. Alternatively, if the cost is not a concern, using SSDs can also provide a noticeable performance boost.
3. Slow Network Transmission
Slow network transmission can occur when the client and server are on different networks or in different regions. In such cases, optimizing the entire protocol stack can be beneficial.
- In terms of physical deployment, services should be positioned closer to the target users and within the same network to minimize routing hops. However, if the target users are spread out, this approach may not be effective.
- When considering the transport layer, it's beneficial to optimize TCP parameters such as net.ipv4.tcp_max_syn_backlog, net.ipv4.tcp_rmem, and net.core.somaxconn on Linux. Utilizing superior congestion control algorithms like BBR is also an option.
- Regarding the application layer, it's advisable to activate more efficient transport protocols like HTTP2 and QUIC.
- In the realm of application development, a variety of optimization techniques exist. These include combining and minifying multiple CSS/JS files to mitigate the slow start latency caused by scattered loading, compressing text-based files during transmission, implementing caching at different levels such as browser, memory, disk, and middleware, storing external resources locally, encoding image content using base64, and applying for multiple domains for the website to bypass the browser's limitation of six TCP connections per domain.
- As for using EdgeOne, Tencent Cloud EdgeOne boasts a broad global deployment with a multitude of caching nodes. Once resources are cached on these nodes, subsequent clients can directly retrieve content from the closest node, drastically reducing latency due to geographical differences. Moreover, Tencent EdgeOne supports intelligent compression and transmission, as well as HTTP2/QUIC protocols, which can enhance transmission efficiency without necessitating significant modifications to the website.
Overall, integrating the website with EdgeOne is the easiest, most cost-effective, and most effective way to accelerate performance.
Finally, let's use an example of a static website to demonstrate the effects of applying these optimization techniques.
Engaging in Practical Exercises
This is an example page from AdminLTE3, with many resources being loaded on the homepage. By sorting the loading times from longest to shortest, we can see that before optimization, the page took a total of 8.48 seconds to load. The adminlte.min.css file alone took 4.68 seconds, which was the most time-consuming.
Upon inspecting the server response, we can see that headers like Transfer-Encoding and Content-Encoding are missing, indicating that compression is not enabled.
Enable compression in Nginx
We configure the Nginx server to enable compression and observe the results.
We can see that the loading time for adminlte.min.css is reduced to 724ms, which is only 15% of the previous time. The overall website loading time is now 6.02s, which is lower than the previous 8.48s.
The server response headers now include Content-Encoding and Transfer-Encoding.
Integrate with EdgeOne
Let's explain the process of integrating with Tencent EdgeOne, which can be done in just a few simple steps to enable CDN acceleration.
1. Domain integration
In the Tencent EdgeOne console, the simplest operation is to enter the acceleration domain and the source server IP, then confirm and submit to create the domain configuration.
2. Adjust DNS resolution
After creating the domain configuration, a CNAME will be assigned, which is crucial for EdgeOne integration. We only need to add a CNAME record pointing to this assigned CNAME for the original domain.
The final DNS resolution relationship should look like this:
3. Check domain configuration
Tencent EdgeOne has enabled security protection features for static sites by default, among other functions, as shown in the figure. Readers can explore on their own.
4. Verify the acceleration effect
Access the website again. Since the requests are served by the nearest CDN nodes, the loading latency is further reduced. The overall loading time is now only 3.24s, significantly faster than the 6.02s after enabling compression on the original site.
There are many ways to optimize the loading speed of a website. Developers with the necessary skills and a love for tinkering can speed up the process by adjusting software design, architecture, and server configurations. In addition to this, the simplest and most convenient method is to connect the website to a CDN (Content Delivery Network), quickly enabling compression and QUIC features. This achieves the goal of saving costs, providing flexibility, and significantly increasing speed.

