The EdgeOne data analysis page supports users to custom filter the time range. The following mainly introduces two ways to filter the time range.
Note:
In order to improve the query efficiency, the granularity of data in different time ranges is as follows:
Time Range ≤ 2 hours: 1 minute.
2 hours < Time Range ≤ 48 hours: 5 minutes.
48 hours < Time Range ≤ 7 days: 1 hour.
Time Range > 7 days: 1 day.
Method 1: Set the query time range through the filter bar
Quick Query: Quickly query the corresponding time range data by clicking on the buttons such as "Last 30 minutes","Last 1 hours", "Last 6 hours", "Today", "Yesterday","Last 3 days","Last 7 days"
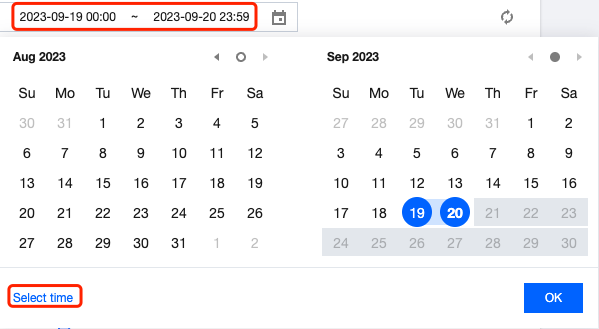
Custom Query: You can query the data within the custom time range by selecting a specific date and time range.
Note:
1. When you select "Last 30 minutes","Last 1 hours", "Last 6 hours", "today", the page will Show the data of the Last 30 minutes,last 1 hour, 6 hours, and the current day (starting from 00:00) and refresh every 5 minutes.
2. The maximum query time range for a single time is 31 days.
3. Due to different Plan versions, different sites may support different data query ranges. For details, please refer to the Plan selection comparison.
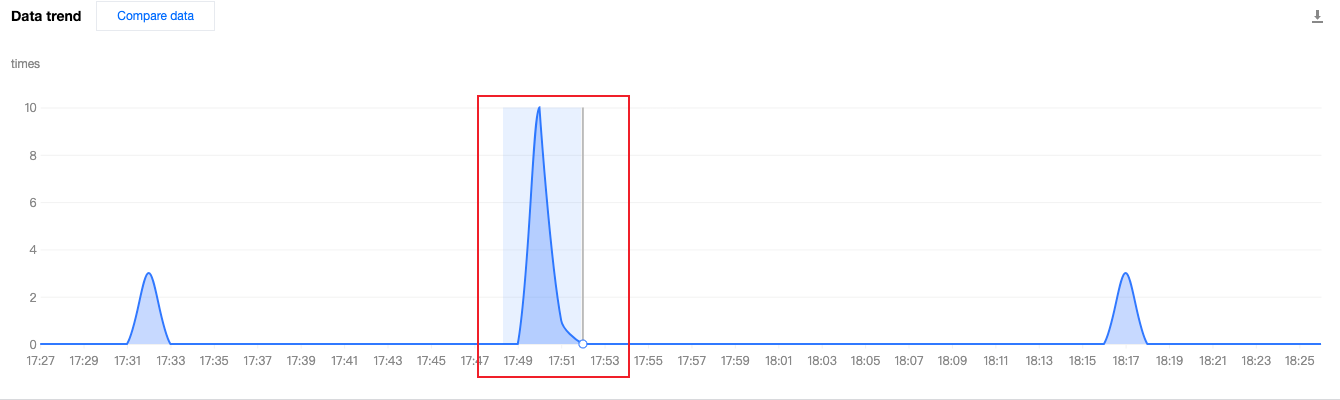
Method 2: Select the query time range on the time trend chart
If you want to View the specific time period on the curve, as shown in the figure below, you can select the specific region of the curve by clicking and sliding the mouse on the curve. The time range corresponding to this region will be backfilled to the top filter bar and affect the statistics of other data on the page.