

Log Analysis(Beta) Overview
Overview
Log Analysis (Beta)
Use cases:
Security analysis and investigation:
Access trend insight:
Performance troubleshooting:
Log audit and compliance:
Note:
The Log Analysis (Beta) feature is now available for Enterprise plans.
Log Analysis (Beta) currently supports layer 7 access logs, including web security block logs, and managed rule logs. Logs are stored for 31 days by default. The 183-day retention capability is currently in beta testing. To request access, please contact us.
Billing Overview
After Log Analysis (Beta) is enabled, we will charge value-added service fees based on the peak log storage volume during the billing cycle. For details, refer to Log Analysis Fees (Postpaid).
Quick Start
The Log Analysis feature is currently available through an allowlist during beta testing. After activation, create a log delivery task with the destination set to EdgeOne Log Analysis via Real-time Log Delivery. You can then view delivered logs at EdgeOne Console > Service Dashboard > Site Detail > Log Service > Log Analysis. For detailed configuration steps, see Deliver to EdgeOne Log Analysis.
Supported Capabilities
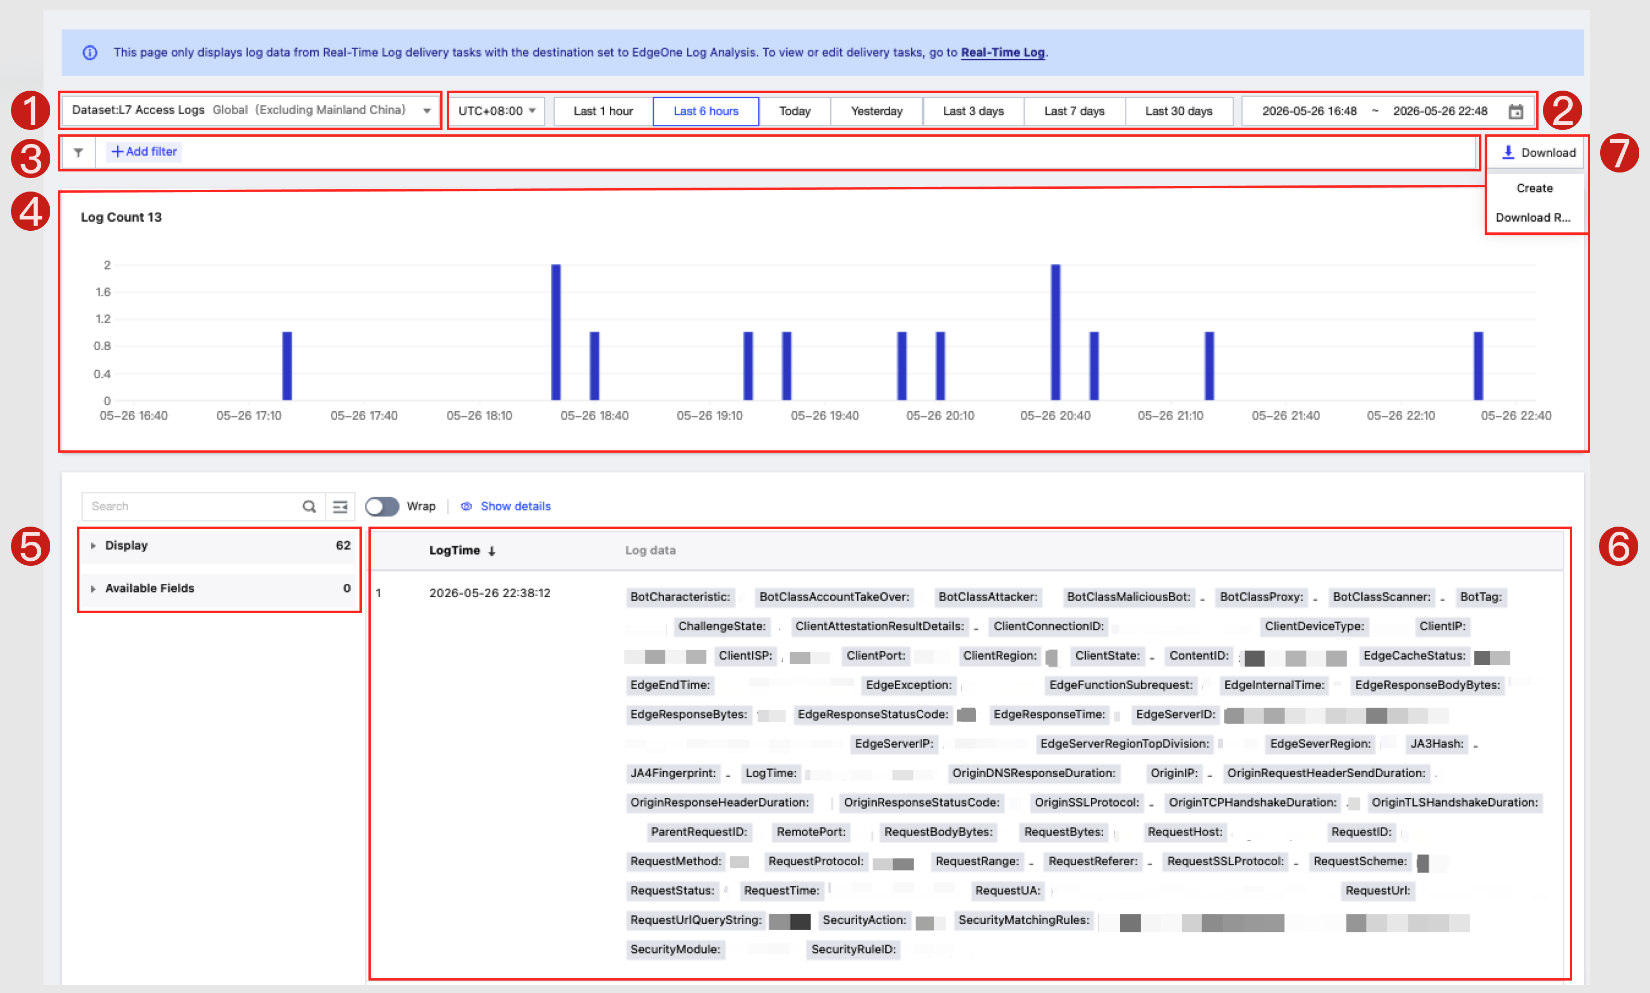
1. Log Sources
Switch the log data source displayed on the current page. Available log sources correspond to real-time log delivery tasks created for the current site and delivered to EdgeOne Log Analysis.
2. Log Time Range
Customize the query time range. Logs can be queried for any time range within the current retention period. For details, please refer to How to Modify Log Analysis Query Time Range.
3. Adding Filters
Supports filtering based on various fields such as status code, request path, country/region, user agent (UA), and referer. For details on filter logic and available fields, please refer to How to Use Log Analysis Filter Conditions.
Note:
A single request may hit multiple rules. When filtering by Rule ID, logs of other rules hit at the same time will also be displayed.
4. Log Volume Trend Chart
The Log Analysis page provides a visual log volume trend chart. Based on the selected filters and time range, the chart displays log volume trends at different granularities, including minute, hour, and day. It helps identify changes in request volume, Web Security rule hits, and error distribution.
5. Specified and Available Fields
Display specified fields
: By default, the fields defined in the current real-time log delivery task are displayed. The fields shown in log details can be modified by hiding or reordering fields in Log Detail.Available fields:
6. Log Detail
The Log Details section displays raw log entries that match the current filter conditions and time range. Logs can be sorted by time in ascending or descending order. Each row represents a single Layer 7 request log, containing two columns: Log Time and Log Data. The fields shown in the Log Data column are determined by the Display Specified Fields settings.
7. Downloading Logs
Click Download to export the query result under the current filter conditions and time range. After a successful download task creation, you can view the progress and details in Download Records. Once the file generation is complete, you can download the CSV file.
Note:
A download task cannot be created while log results are loading or when the query result is empty.