The Custom Statistics Metrics feature allows users to flexibly configure personalized business monitoring. With this feature, users can precisely define and track key traffic and performance metrics for websites or APIs, gaining deep business insights. EdgeOne pushes user-defined metrics to Tencent Cloud Observability Platform (TCOP), enabling users to build customized alert policies (e.g., monitoring traffic from specific countries or regions) to monitor business status in real time, detect and respond to potential issues promptly, and ensure business continuity and stability.
Feature Details
Supported Metrics
Currently supported base metrics include:
L7 client traffic
Total traffic
EdgeOne response traffic
Client request traffic
L7 client bandwidth
Total bandwidth
EdgeOne response bandwidth
Client request bandwidth
L7 client requests
Note:
1. For the meaning of each base metric, refer to Metric Analysis.
2. Supported filter conditions:
2.1 No grouping (global site-level statistics): Host, country/region, province, ISP, cache status, HTTP/HTTPS, status code.
When users choose to group by Host, Province, or ISP, EdgeOne’s data processing system aggregates statistics based on actual values in access logs—similar to SQL’s GROUP BY clause. Each aggregated dimension combination is reported separately to Tencent Cloud Observability Platform. This allows alert policies to trigger notifications when any dimension combination meets the alert condition.
For example:
Traffic for Domain A in Shanxi Province via China Telecom
Traffic for Domain A in Guangdong Province via China Unicom
These will be separately counted, reported, and evaluated for alerts.
Supported Grouping Dimensions
Currently EO supports the following grouping dimensions:
Host
Country/Region
Top subdivision (Province)
ISP
Note:
Enum values for countries/regions, Chinese provinces, and Chinese ISPs are listed in corresponding code enumeration. These enumeration values will appear in the alarm content received by users.
Province and ISP are only supported for mainland China. Overseas data will be labeled as Global(MLC excluded).
Limitations
Data Reporting Latency
EdgeOne collects logs from global nodes in real time, processes them based on user-defined filters, and pushes the results to Tencent Cloud Observability Platform. Due to the complexity of this pipeline, there is a ~10-minute delay from data collection to dashboard display.
Alert notifications may arrive 10–12 minutes after the actual event.
This latency is acceptable for most monitoring scenarios but should be considered when configuring time-sensitive alerts.
Plan Support Differences
Custom Statistics Metrics is available only in Trial, Standard, and Enterprise editions. Trial edition: max 10 global + 3 grouped metrics per site.
Custom statistics metrics - global site aggregation
Not supported
15/site
15/site
Custom statistics metrics - grouped by specified dimensions
Not supported
3/site
3/site
Use Case Examples
Example 1: Monitoring Traffic from Specific Countries or Regions
Scenario Description
In a globalized business environment, it is crucial for enterprises to monitor traffic from specific countries or regions and configure alerts. This involves not only a quick response to market dynamics but also continuous assurance of service quality. By using the feature of custom statistics metrics, users can achieve detailed monitoring of traffic in key regions and set up alert mechanisms based on the data to take swift action in case of abnormal traffic.
Directions
Step 1: Creating an EdgeOne Custom Statistics Metric
1. Log in to the Tencent Cloud EdgeOne console, enter Service Overview in the left menu bar, and click the site to be configured under Website Security Acceleration.
2. On the site details page, click Alert Service > Custom Statistics Metrics.
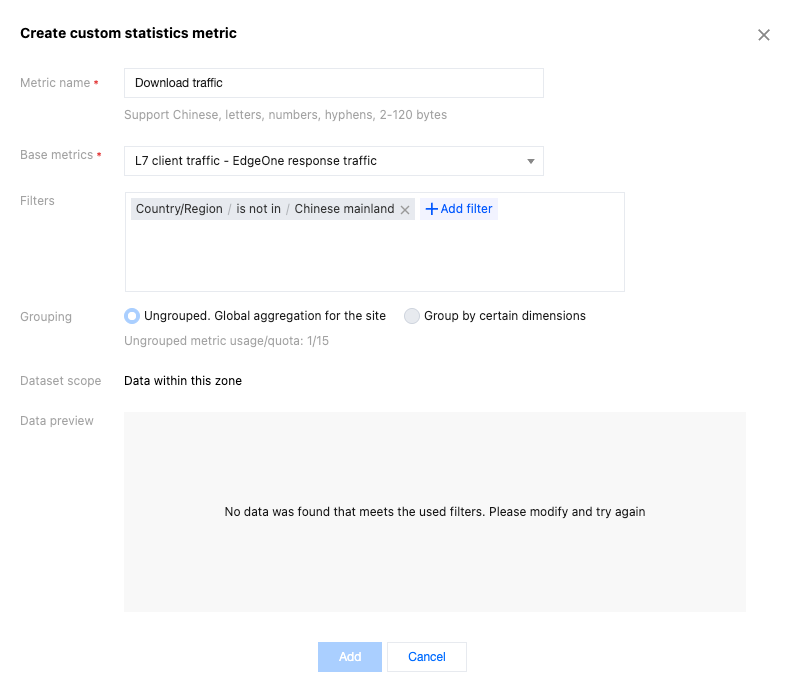
3. On the custom statistics metrics page, click Create Custom Statistics Metric.
4. In the pop-up window, enter the metric name, which supports Chinese characters, letters, digits, and hyphens, with a length of 2 - 120 bytes.
5. Select the base metric "L7 client traffic - EdgeOne response traffic".
6. Set the filter conditions to specify the country/region, such as "Country/Region is not in Chinese mainland". The data preview area will display the data for the past 7 days based on the base metric and filter conditions configured by the user.
7. Click Add to save the configuration. The system will start collecting access data under the above conditions and begin pushing it to the TCOP.
Step 2: Creating an Alarm Policy
1. After creating the custom statistics metric, click Configure Alert Policy in the operation column of the custom statistics metric list. The new page will redirect to Tencent Cloud Observability Platform - Alarm Management - Alarm Configuration - Create Policy, and the corresponding EO custom statistics metric will be automatically selected as the alert object.
4.1 Confirm whether the preset notification template meets expectations. If a custom notification template is needed, see Creating Notification Template.
4.2 After selecting the required notification template, click Complete to save the configuration.
Example 2: Monitoring and Alerting Traffic Targeting ISPs in Chinese Mainland Province
Scenario Description
Users can monitor ISP traffic at a granular level across provinces in the Chinese mainland and set up alerting mechanisms based on this data. This way, when exceptional fluctuations occur in a certain province's traffic, the system can promptly report alarms, helping businesses quickly locate problems and take corresponding measures, thereby ensuring business continuity and stability.
Directions
Step 1: Creating an EdgeOne Custom Statistics Metric
1. Log in to the Tencent Cloud EdgeOne console, enter Service Overview in the left menu bar, and click the site to be configured under Website Security Acceleration.
2. On the site details page, click Alert Service > Custom Statistics Metrics.
3. On the custom statistics metrics page, click Create Custom Statistics Metric.
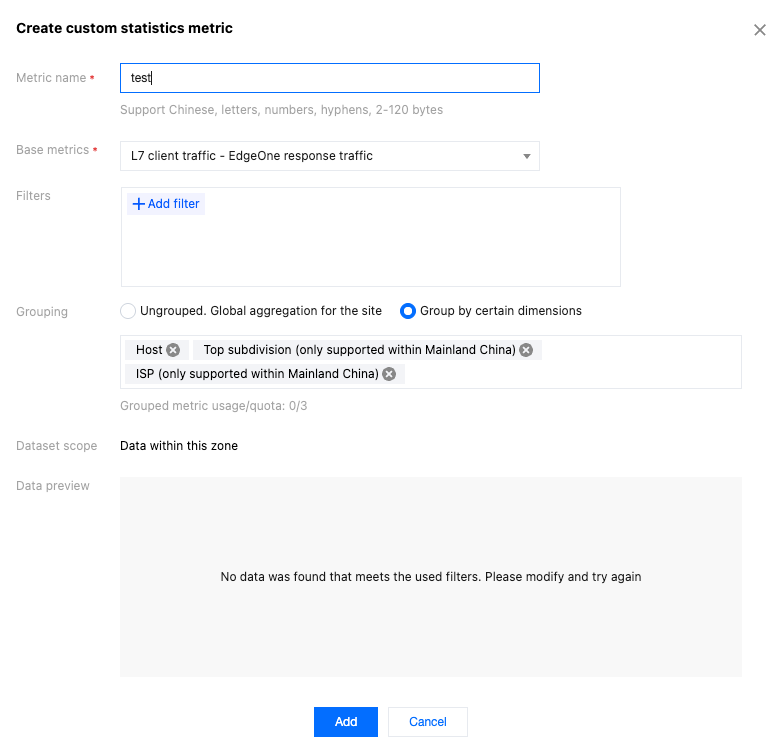
4. In the pop-up window, enter the metric name, which supports Chinese characters, letters, digits, and hyphens, with a length of 2 - 120 bytes.
5. Select the base metric "L7 client traffic - EdgeOne response traffi".
6. Select "Group by specified dimension", and choose Host, Top subdivision (only supported in Chinese mainland), and ISP (only supported in Chinese mainland) from the drop-down list below.
7. Click Add to save the configuration. The system will start collecting access data under the above conditions and begin pushing it to the TCOP.
Step 2: Creating an Alarm Policy
1. After creating the custom statistics metric, click Configure Alert Policy in the operation column of the custom statistics metric list. The new page will redirect to Tencent Cloud Observability Platform > Alarm Management > Alarm Configuration > Create Policy, and the corresponding EO custom statistics metric will be automatically selected as the alert object.
4.1 Confirm whether the preset notification template meets expectations. If a custom notification template is needed, see Creating Notification Template.
4.2 After selecting the required notification template, click Complete to save the configuration.