Web Debugging
The web debugging page is mainly used to debug the execution results of edge functions. You can enter this debugging page by clicking Edit Code within the edge function.
Directions
1. Log in to the Tencent Cloud EdgeOne console, enter Service Overview in the left menu bar, and click the site to be configured under Website Security Acceleration.
2. On the site details page, click Edge Functions > Function Management.
3. On the function management page, click the specific function name and then click Edit Code to enter the web debugging page. If no function has been created, refer to the guide on creating and deploying a function to create a function first.
4. After adjusting the code, click Save and deploy to quickly deploy the adjusted code to the current website. Then you can experience the features of the current website such as console debugging, HTTP request and response debugging, and request preview. For detailed operations, see Supported Web Debugging Features.
Note:
To effectively perform the console debugging, HTTP request and response debugging, and request preview operations, you must ensure that the default domain name of the function has taken effect, or the function has been configured with triggering rules. Please perform the above operations after confirming that the default domain name of the function has taken effect or the function triggering rules have been configured.
Supported Web Debugging Features
Web debugging supports the following debugging operations of the current website:
Console debugging: Supports printing the console messages, including LOG, INFO, NOTICE, DEBUG, WARN, and ERROR messages.
LOG: Outputs general messages about program status, variable values, and so on, to help developers get real-time information on program execution.
INFO: Outputs prompt messages about operation success, data load completion, and so on, to provide positive feedback for developers.
DEBUG: Outputs debugging messages, to help understanding the details of program execution.
WARN: Outputs warning messages, to describe program issues that are not errors but worth attention.
ERROR: Outputs error messages, to record the program execution errors that should be resolved by developers.
NOTICE: Outputs notice messages at a level between INFO and WARN, to remind developers of important but not urgent situations.
HTTP request and response debugging: Supports adding HTTP request headers and sending HTTP requests, and enables users to quickly view the response content, including the response status, response header, and response body.
Custom HTTP headers: Allows users to add or modify HTTP request headers to simulate different request scenarios.
Instant response preview: Enables users to view the HTTP response, including the response status code, response header, and response body immediately after a request is sent.
Request preview: Supports viewing the response body content of the request results, and enables users to intuitively preview and analyze the corresponding data in the console.
Console Debugging
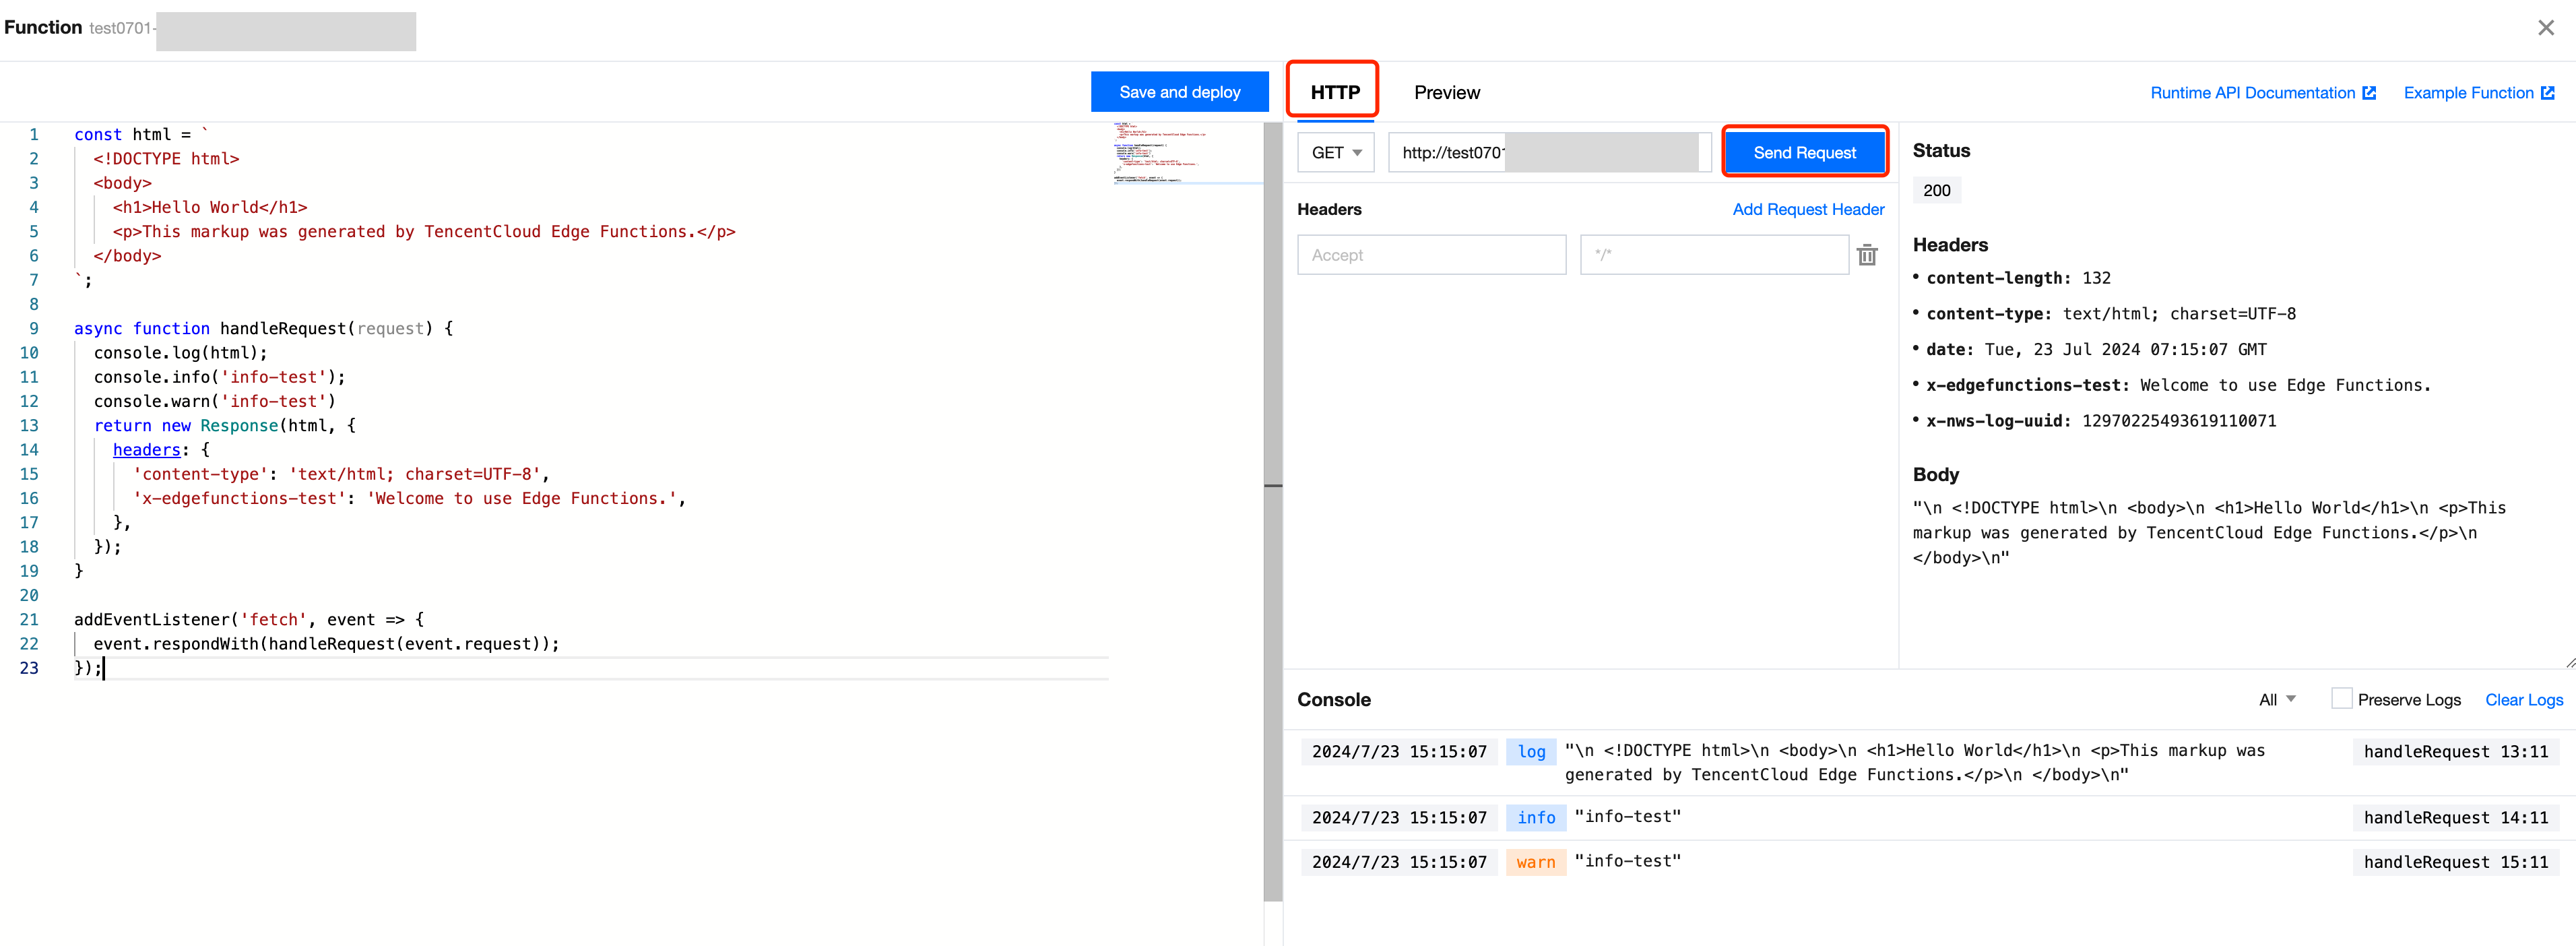
On the HTTP page, you can select a request method from GET, POST, PUT, PATCH, DELETE, HEAD, and OPTIONS, and click Send Request to print the console messages in the code. The types include LOG, INFO, NOTICE, DEBUG, WARN, and ERROR.

Filtering Console Log Types
On the HTTP page, select All in the dropdown list. It supports filtering a specific type of console messages, as shown in the figure below:

Preserving All Debugging Logs
On the HTTP page, check Preserve Logs to preserve the console messages after clicking Send Request each time, as shown in the figure below:

Clearing Console Logs
On the HTTP page, click Clear Logs to clear the console messages already printed currently.
Console message composition:
Time: time point when the console message is printed, e.g., 2024/3/25 20:01:42.
Type: type of the console message, including LOG, INFO, NOTICE, DEBUG, WARN, and ERROR.
Content: printed content for a specific type of console message, such as info-test.
Function name and position: Specific function to which the console message belongs, and its location (row and column) in the code. For example,
handleRequest 11:12 indicates that the console message belongs to the handleRequest function and is located at row 11 and column 12 in the code.HTTP Request and Response Debugging
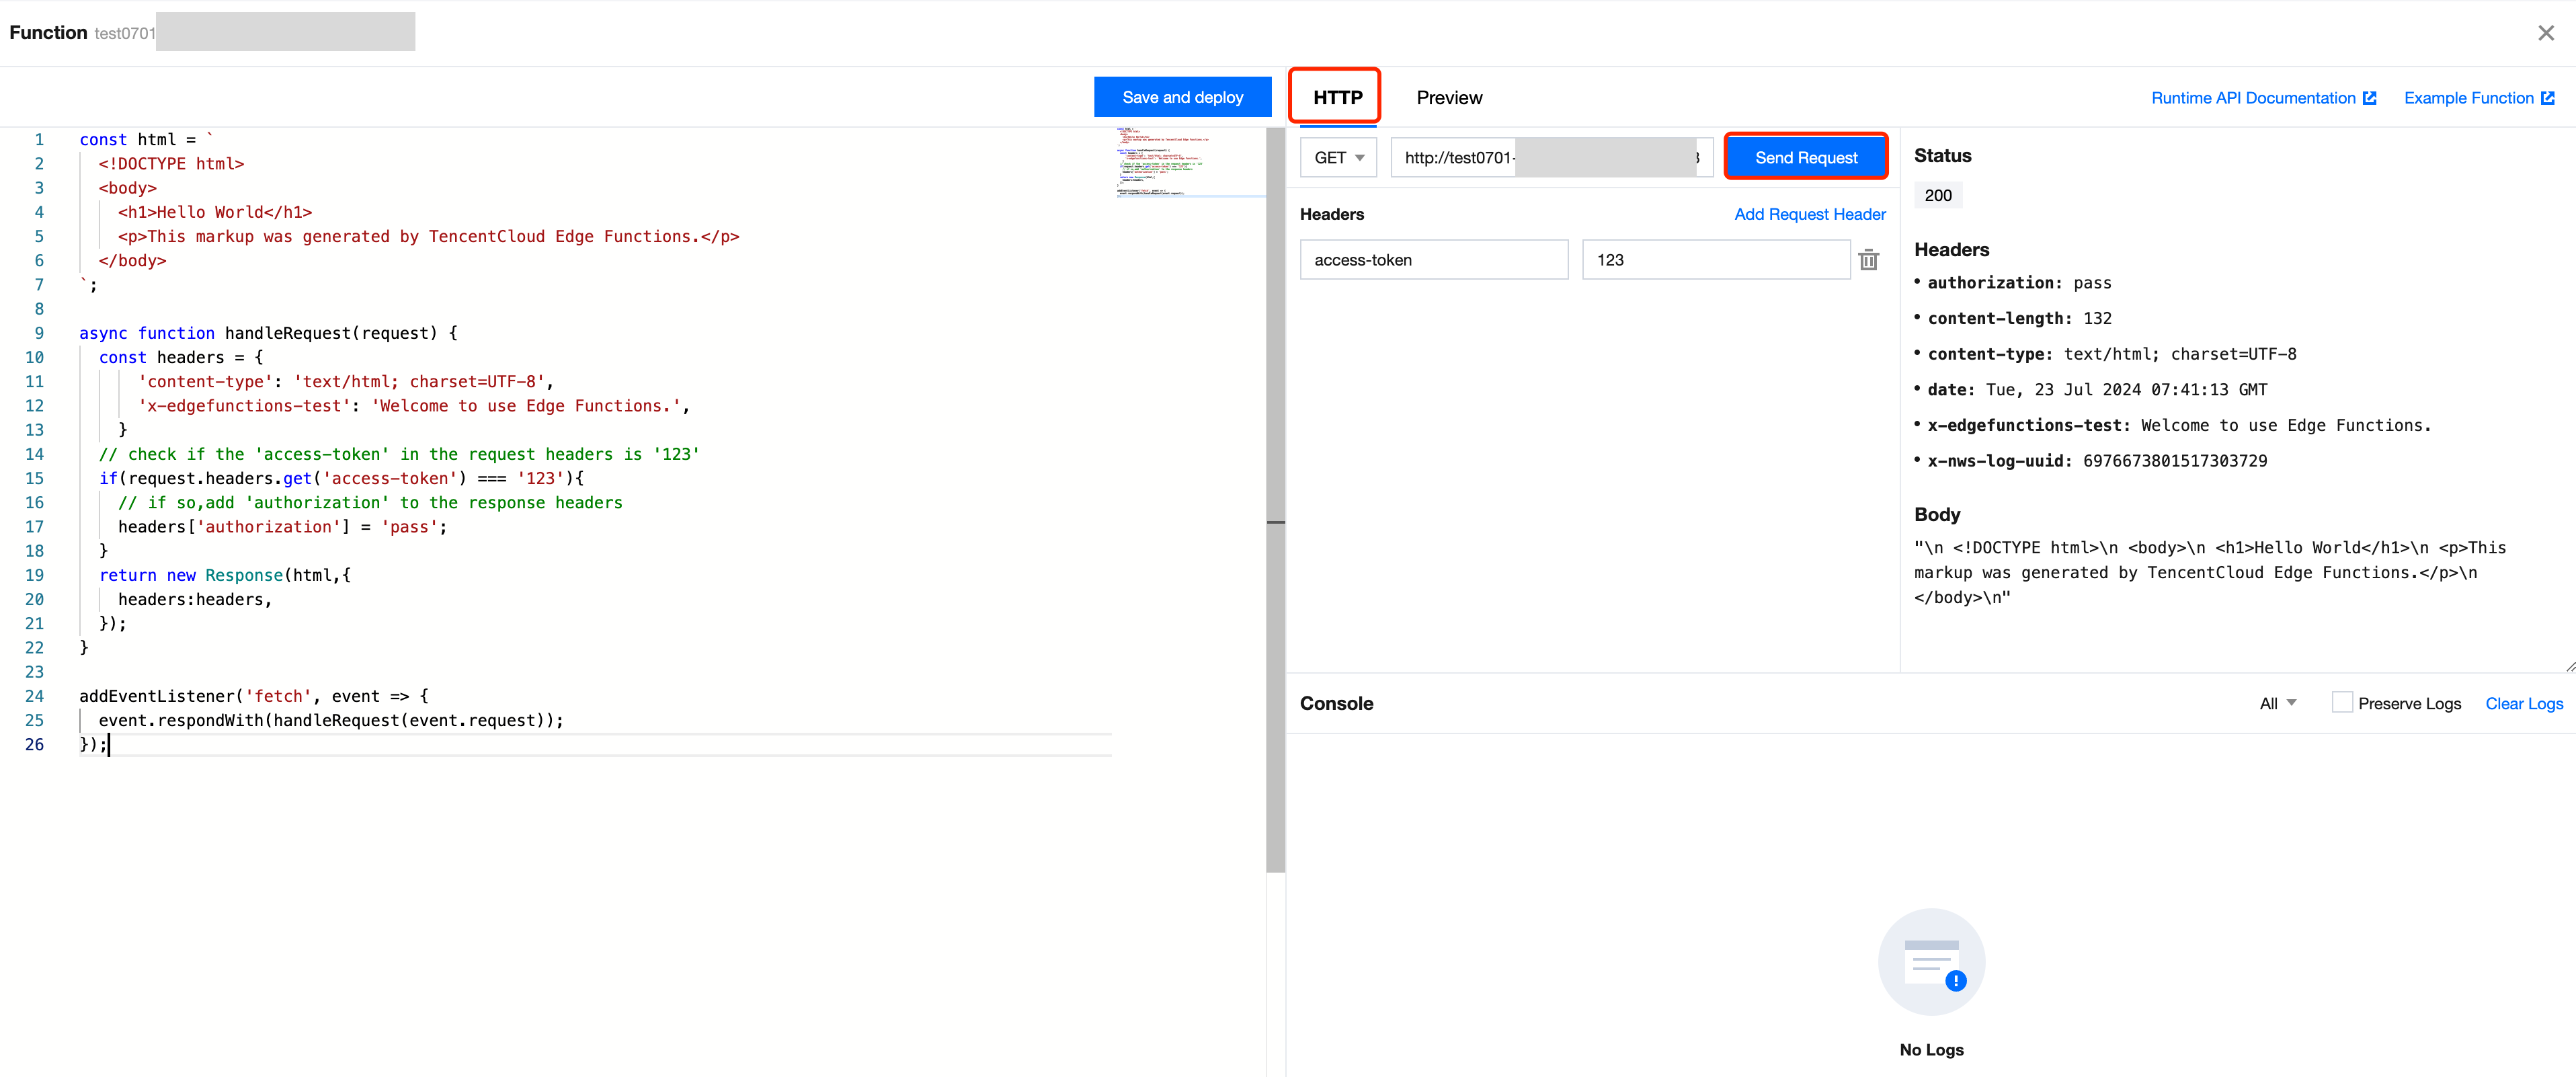
On the HTTP page, add the headers required for testing based on the scenario, and click Send Request to get the response status code, response header, and response body.

In the above figure, click Add Request Header
access-token and set its value to 123. The semantic logic of the code is to determine whether the request header contains access-token with the value 123, and if yes, return the response header authorization with its value set to pass.Request Preview
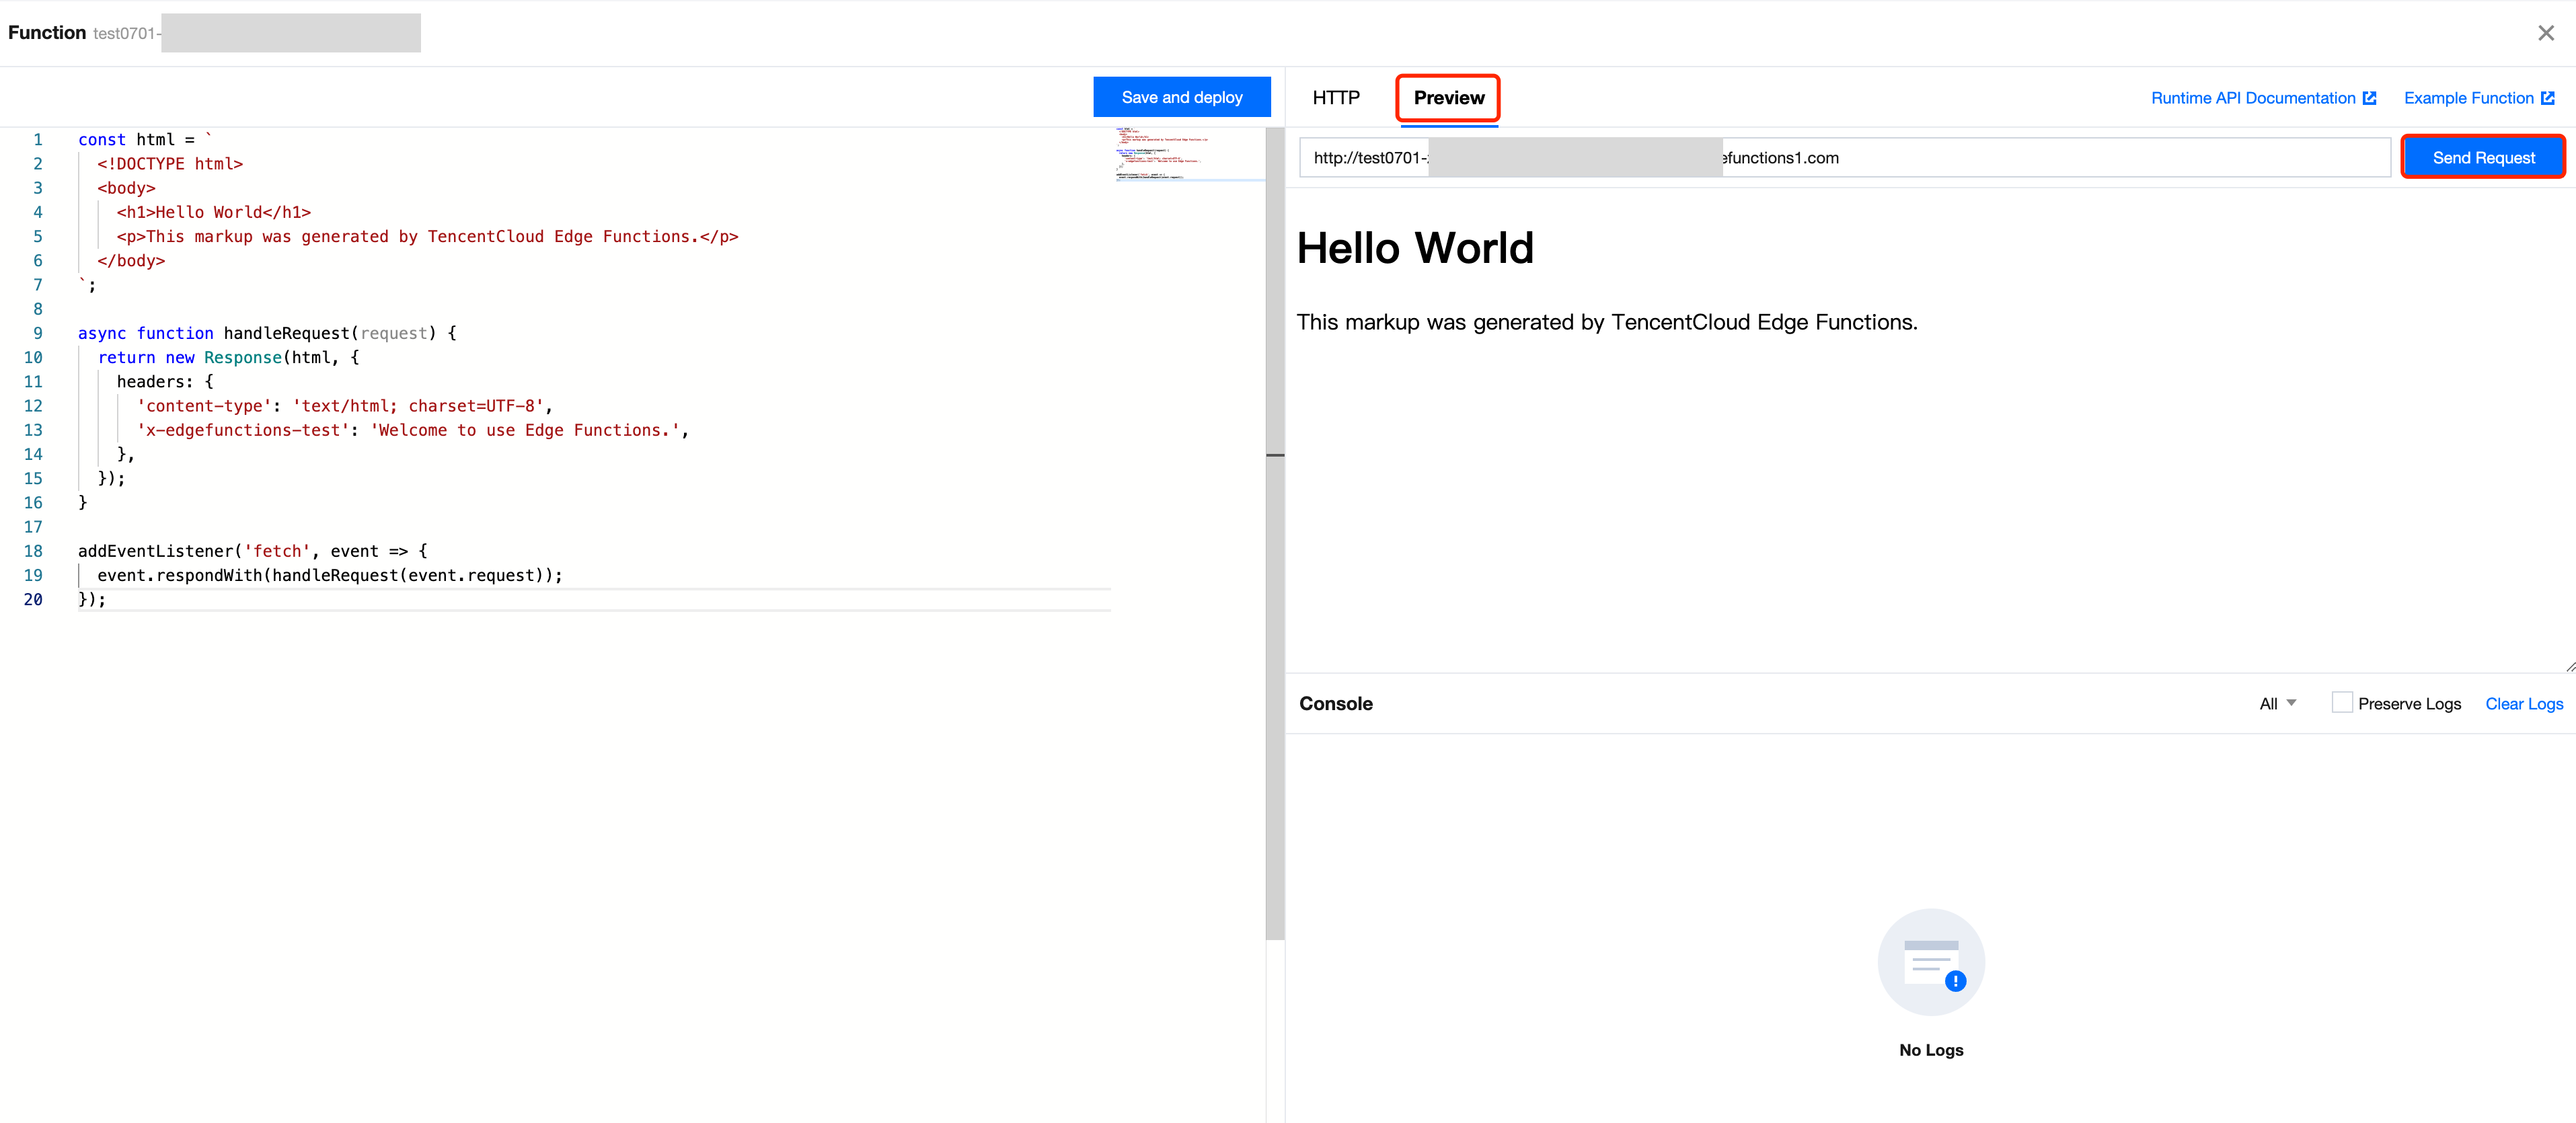
On the Preview page, click Send Request to directly render and preview the content of the response body.
